Challenge
During an AI-focused hackathon, we explored a recurring issue in data work and journalism:
Much published information exists only as charts and infographics, making direct reuse difficult because values are not exposed as structured data.
Main question:
Can multimodal AI models reconstruct a dataset from a visualization?
Proposed solution
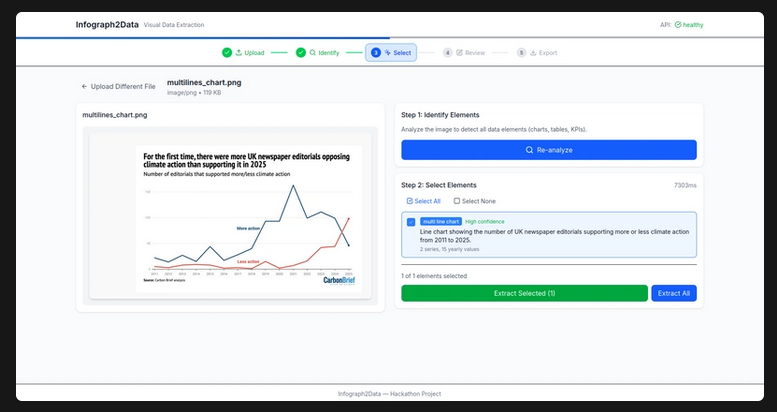
The Infograph2Data prototype transforms visualizations into usable datasets.
Workflow:
- User uploads an image or PDF with a chart
- App detects visual components
- Multimodal model analyzes the chart
- Detected values are converted to structured tables
- User exports the result
Supported formats include PNG/JPG screenshots, infographics, and PDFs.
Stack
- Python, FastAPI, Pydantic
- OpenAI multimodal models
- JSON structured extraction
- Poppler/pdf2image for PDF conversion
- pytest with high test coverage
- Docker + Hugging Face Spaces for demos
Result
The project delivered a functional MVP proving that multimodal models can recover datasets from visual artifacts, even when some values must be estimated.